


Two working pages for a small content site — an article index and an article with an image, a table and two charts. Plain HTML, CSS and JavaScript: copy the folder, change the content, publish.
What it is
The starter is the shortest path from Rare Styles to a published site with articles and charts. It is not a theme and not a framework: no build step, no generator, no package to install. Every page works opened straight from disk, from any static host, and under a sub-path like example.com/notes/.
starter/
├── index.html          article index
├── article.html        an article: prose, figures, a table, two charts, a note
└── assets/
    ├── project.css     your layer: brand tokens and the article layout
    └── img/            example images, replace with your own
How to use it
- Download and open. Download the archive, unpack it and open
index.htmlin a browser. Nothing to install and no server to run: Rare Styles and RareCharts come from the CDN through an ordinary<link>and<script>in<head>— the way every site on the library connects them. - Make it yours. It is plain HTML: change the text, add your images and media, copy the blocks you need. The demo article already shows the most common elements styled — headings, lists, a quote, a figure with a caption, a table and even charts — so most of the time you copy a block and edit it. Brand colours and fonts are tokens at the top of
assets/project.css; your own rules go in that file too, never inrare.css, so a library upgrade cannot overwrite them. If something is unclear, look it up in the Styles documentation, or ask your AI agent to read the instruction banners at the top ofrare.cssandrare-charts.min.js— they state the rules of each library and link the docs. - Publish. Upload the folder as it is to any static host. With a site generator or a CMS, the two pages are your templates: keep the markup and move the repeating parts into its partials.
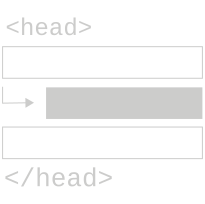
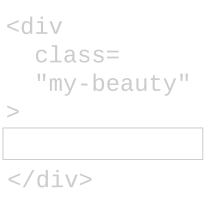
The only integration step is the rd class on <html> — see Getting Started for page mode and islands.
Charts
The article has two interactive charts — a line with range buttons and a tooltip, and a bar chart. Each one is a container and a few lines of script at the end of the page: new RareCharts.Line('#chart-index', options).setData(data). Title, subtitle, legend and source are options the chart sets in place. Copy a chart, change its data and options, and it follows.
Other chart types, data shapes and options are in the RareCharts documentation. An AI agent can start from the banner at the top of rare-charts.min.js: it lists the chart types, how to construct one and where each option is documented.
Versions
Rare Styles and RareCharts are pinned to exact versions — the stylesheet URL in both pages and the RareCharts script URL in the article. A new release changes nothing on your site until you change the pin. Read the changelog before you upgrade.
The full walkthrough is in the starter's README.